We reduce forecast error by up to 30%
Our fully automated forecasting model leverages data such as promotions, shortages, prices, holidays, and sell-outs to reduce forecast error by up to 30%. It even forecasts the sales of new products before they hit the market. Our model is used worldwide by manufacturers, distributors, retailers, and even software vendors.
Forecasting Accuracy Matters
-
For every 1% of forecast improvement, a consumer goods company could achieve
- 2.7% reduction in finished goods inventory,
- 3.2% reduction in transportation costs, and
- 3.9% reduction in inventory obsolescence.
Gartner
-
From our experience, 15% forecast accuracy improvement will deliver a 3% or higher pre-tax improvement.
The Institute of Business Forecasting
-
Improving forecasting accuracy by 10 to 20% translates into a potential 5% reduction in inventory costs and revenue increases of 2 to 3%.
McKinsey Global Institute
-
Simulations show that a 10% forecasting improvement would result in 6% shortage reduction or 4% inventory reduction.

But 50% of demand planners reviews worsen accuracy.
How can we do better?

Client Pains
-
Low Accuracy & High Bias
Poor accuracy harms your supply chain: you’ll get too much inventory of the wrong products, and not enough of the right ones. You will face overstocks and shortages – often at the same time. These poor forecasts can be due to unreliable models or stakeholders inputting numbers to match their own agendas, rather than their actual predictions.
-
Manual workload
Planners often spend their time reviewing historical demand, inputting promotions, accounting for shortages, and manually tweaking forecasting parameters. All these tasks should be automated through machine learning.
-
No Added Value from Demand Planners
Once you automate low-value tasks, planners can focus on value-added tasks: ensuring clean input data for the automated model, and collecting insights beyond what the model knows. This way, planners can really start enriching the forecasts.
How is SupChains’ Inventory Model Different?
-
Business Insights
Our model uses your business data to deliver accurate forecasts. It can be fed with promotional calendars (historical and future), prices, shortages, sell-out sales, client inventory levels, future orders, and the weather. Our model also captures product cannibalization, as well as overall trends and seasonality.
-
Forecasting New Products
By design, our model can forecast brand new products even before they hit the market.
-
Robust, Fast, Simple
We build our models to last. They process and clean your data, delivering clear inconsistency reports while running hundreds of checks before and after generating forecasts.
Test it yourself with our simulator
Impact 1
We increase service level while keeping same inventory
- – Extra revenue thanks to higher service level – computed based on lost sales
- – Extra profits thanks to higher service level – computed based on lost sales
- – Extra revenue thanks to higher service level – computed based on service level
- – Extra profits thanks to higher service level – computed based on service level
- in m$/year
Impact 2
We reduce inventory while keeping service level constant
- – Cash saved because of inventory reduction in m$
- – Savings thanks to inventory reduction in m$/year
- – Savings thanks to obsolete reduction in m$/year
- – Total savings in m$/year
- in m$/year
Typical Implementation Plan
Request your proof of concept
-
Step 1
Scope definition
1 to 2 weeks
-
Step 2
Data gathering and cleaning
A few months
-
Step 3
Model creation
1 to 3 weeks
Why they trust us
Learn more about Forecasting
Read our book
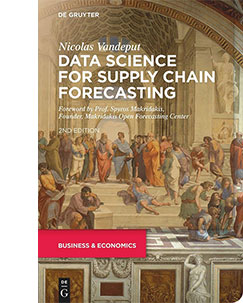
Data Science for Supply Chain Forecasting
310 pages
April 2021
Watch our video
