
Demand Forecasting KPIs – Our in-depth guide for practitioners
This article focuses on the quantitative aspects of demand forecast accuracy. For the sake of simplicity, we will look at the error on the very next period (lag 1) and at a single item at a time.
Demand Forecasting KPIs – Forecast Error
Measuring forecast accuracy (or error) is not an easy task, as there is no one-size-fits-all indicator. Only experimentation will show you which Key Performance Indicator (KPI) is best for you. As you will see, each indicator will avoid some pitfalls but will be prone to others.
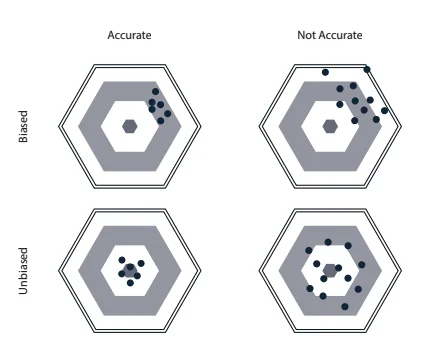
The first distinction we have to make is the difference between the accuracy of a demand forecast and its bias.
Accuracy
The accuracy of your forecast measures how much spread you had between your forecasts and the actual values. The accuracy gives an idea of the magnitude of the errors, but not their overall direction.
Bias
The bias represents the overall direction of the historical average error. It measures if your demand forecasts were on average too high (i.e., you overshot the demand) or too low (i.e., you undershot the demand).
Of course, as you can see in illustration below what we want to have is a demand forecast that is both accurate and unbiased.
Computing the Demand Forecast Error
Let’s start by defining the error during one period (et) as the difference between the forecast (ft) and the demand (dt).
et = ft − dt
Note that with this definition, if the forecast overshoots the demand, the error will be positive; if the forecast undershoots the demand, the error will be negative.
Demand Forecasting – Bias
The (average) bias of a demand forecast is defined as its average error.
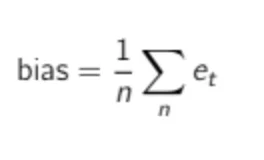
Where n is the number of historical periods where you have both a forecast and a demand (i.e., periods where an error can be computed).
The bias alone won’t be enough to evaluate your forecast accuracy. Because a positive error in one period can offset a negative error in another period, a forecast model can achieve very low bias and not be accurate at the same time. Nevertheless, a highly biased forecast is already an indication that something is wrong in the model.
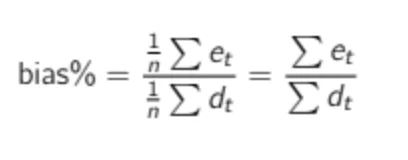
Scaling the Bias The bias computed as in the formula above will give you an absolute value like 43 or -1400. As a demand planner investigating your product forecasts, you should ask yourself the following question: Is 43 a good bias? Without information about the product’s average demand, you cannot answer this question. Therefore, a more relevant KPI would be the scaled bias (or normalized bias). We can compute it by dividing the total error by the total demand (which is the same as dividing the average error by the average demand).
A common mistake (especially in Excel) is to divide the average error observed in a specific time period by the average demand observed in another (wider) time range. As you will see in the DIY sections, be sure to divide the average error by the average demand during the corresponding period.
It usually brings no insights to compute the bias of one item during one period. You should either compute it for many products at once (during one period) or compute it for a single item over many periods (best to perform its computation over a full season cycle).
Demand Forecasting – MAPE
The Mean Absolute Percentage Error (or MAPE) is one of the most commonly used KPIs to measure demand forecast accuracy. MAPE is computed as the average of the individual absolute errors divided by the demand (each period is divided separately). To put it simply, it is the average of the percentage of absolute errors.
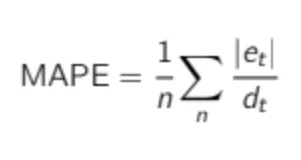
MAPE is a strange forecast KPI. It is quite well-known among business managers, despite being a really poor accuracy indicator. As you can see in the formula, MAPE divides each error individually by the demand, so it is skewed: high errors during low-demand periods will have a major impact on MAPE. You can see this from another point of view: if you choose MAPE as an error KPI, an extremely low forecast (such as 0) can only result in a maximum error of 100%, whereas any too-high forecast will not be capped to a specific percentage error. Due to this, optimizing MAPE will result in a strange forecast that will most likely undershoot the demand. Just avoid it. If MAPE is mentioned in this book, it is not to promote its use, but as a plea not to use it.
Demand Forecasting – MAE
The Mean Absolute Error (MAE) is a very good KPI to measure forecast accuracy. As the name implies, it is the mean of the absolute error.
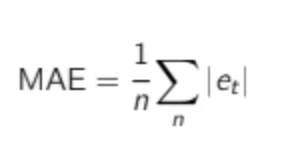
As for the bias, the MAE is an absolute number. If you are told that MAE is 10 for a particular item, you cannot know if this is good or bad. If your average demand is 1,000, it is, of course, astonishing, but if the average demand is 1, an MAE of 10 is a very poor accuracy. To solve this, it is common to divide MAE by the average demand to get a scaled percentage:
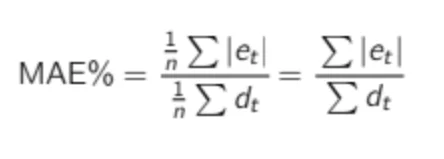
Many practitioners use the MAE formula and call it MAPE. This can cause a lot of confusion. When discussing forecast error with someone, I advise you to explicitly specify how you compute the forecast error to be sure to compare apples with apples.
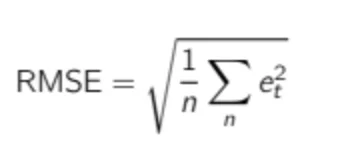
Demand Forecasting – RMSE
The Root Mean Square Error (RMSE) is a difficult KPI to interpret, as it is defined as the square root of the average squared forecast error. Nevertheless, it can be very helpful, as we will see later
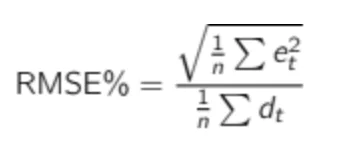
Just as for MAE, RMSE is not scaled to the demand, so it needs to be put in percentages to be understandable. We can then define RMSE% as:
Actually, many algorithms—especially for machine learning—are based on the Mean Square Error (MSE), which is directly related to RMSE.
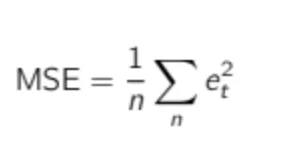
Many algorithms use MSE instead of RMSE since MSE is faster to compute and easier to manipulate. But it is not scaled to the original error (as the error is squared), resulting in a KPI that we cannot relate to the original demand scale. Therefore, we won’t use it to evaluate our statistical forecast models.
A Question of Error Weighting
Compared to MAE, RMSE does not treat each error the same. It gives more importance to the biggest errors. That means that one big error is enough to get a very bad RMSE.
Let’s use an example with a dummy demand time series.
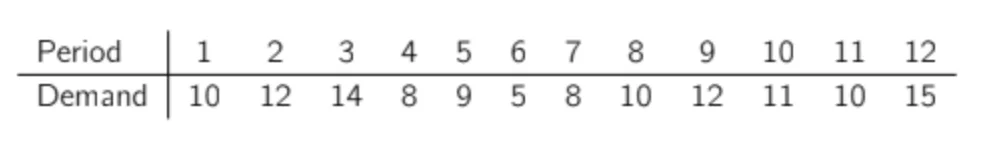
Let’s imagine we want to compare two slightly different forecasts.
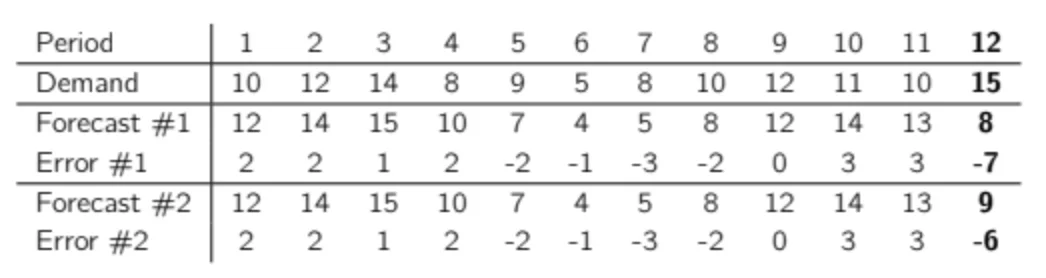
The only difference in the two datasets is the forecast on the latest demand observation: forecast #1 undershot it by 7 units and forecast #2 undershot it by only 6 units. Note that for both forecasts, period 12 is the worst period in terms of accuracy. If we look at the KPI of these two forecasts, this is what we obtain:
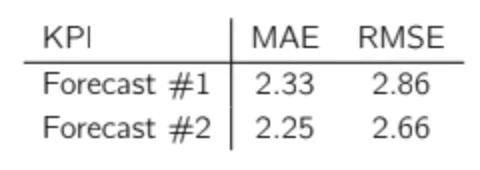
What is interesting here is that by just changing the error of this last period (the one with the worst accuracy) by a single unit, we decrease the total RMSE by 6.9% (2.86 to 2.66), but MAE is only reduced by 3.6% (2.33 to 2.25), so the impact on MAE is nearly twice as low. Clearly, RMSE puts much more importance on the largest errors, whereas MAE gives the same importance to each error. You can try this for yourself and reduce the error of one of the most accurate periods to observe the impact on MAE and RMSE.
Spoiler: There is nearly no impact on RMSE.

