Demand Forecasting – Which Forecast KPI to Choose?

We went through the definitions of these KPIs (bias, MAPE, MAE, RMSE), but it is still unclear what difference it can make for our model to use one instead of another. You might think that using RMSE instead of MAE or MAE instead of MAPE doesn’t change anything. But nothing is further from the truth.
Let’s do a quick example to show this. Imagine a product with a low and rather flat weekly demand that occasionally has a big order (maybe due to promotions, or to clients ordering in batches). Here is the weekly demand observed so far:
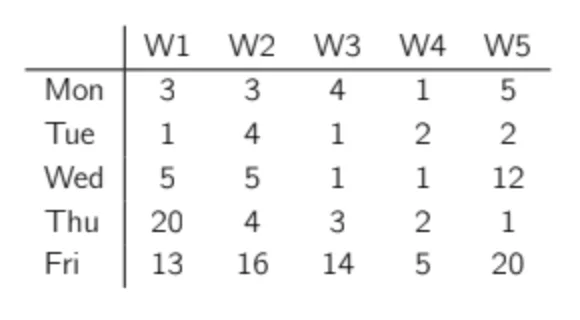
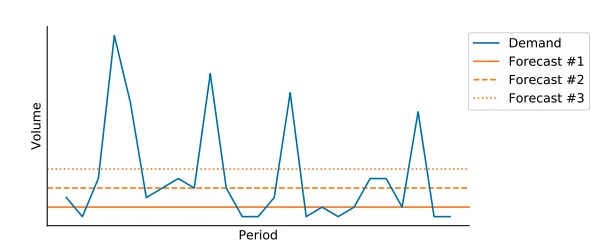
Now let’s imagine we propose three different forecasts for this product. The first one predicts 2 pieces/day, the second one 4 and the last one 6. Let’s plot the actual demand and the forecasts.
You can see in the table how each of these forecasts performed in terms of bias, MAPE, MAE, and RMSE on the historical period. Forecast #1 was the best during the historical periods in terms of MAPE, forecast #2 was the best in terms of MAE, and forecast #3 was the best in terms of RMSE and bias (but the worst on MAE and MAPE).
Let’s now reveal how these forecasts were made:
- Forecast #1 is just a very low amount. It resulted in the best MAPE (but the worst RMSE).
- Forecast #2 is the demand median.2 It resulted in the best MAE.
- Forecast #3 is the average demand. It resulted in the best RMSE and bias (but the worst MAPE).
Median vs. Average – Mathematical Optimization
Before discussing the different forecast KPIs further, let’s take some time to understand why a forecast of the median will get a good MAE while a forecast of the mean will get a good RMSE.
Note to the Reader – The math ahead is not required for you to use the KPIs or the further models in this book. If these equations are unclear to you, this is not an issue—don’t get discouraged. Just skip them and jump to the conclusion of the RMSE and MAE paragraphs.
RMSE
Let’s start with RMSE:
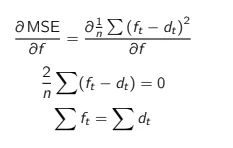
Actually, to simplify the algebra, let’s use a simplified version, the Mean Squared Error (MSE):
If you set MSE as a target for your forecast model, it will minimize it. You can minimize a mathematical function by setting its derivative to zero. Let’s try this.
Conclusion
To optimize a forecast’s (R)MSE, the model will have to aim for the total forecast to be equal to the total demand. That is to say that optimizing (R)MSE aims to produce a prediction that is correct on average and, therefore, unbiased.
MAE
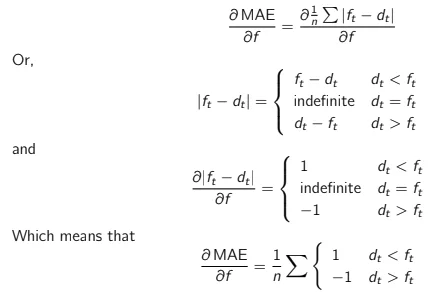
Now let’s do the same for MAE.
Conclusion
To optimize MAE (i.e., set its derivative to 0), the forecast needs to be as many times higher than the demand as it is lower than the demand. In other words, we are looking for a value that splits our dataset into two equal parts. This is the exact definition of the median.
MAPE
Unfortunately, the derivative of MAPE won’t show some elegant and straightforward property. We can simply say that MAPE is promoting a very low forecast as it allocates a high weight to forecast errors when the demand is low.
Conclusion
As we saw in the previous section, we have to understand that a big difference lies in the mathematical roots of RMSE, MAE, and MAPE. The optimization of RMSE will seek to be correct on average. The optimization of MAE will try to overshoot the demand as often as undershoot it, which means targeting the demand median. Finally, the optimization of MAPE will result in a biased forecast that will undershoot the demand. In short, MAE is aiming at demand median, and RMSE is aiming at demand average.
MAE or RMSE – Which One to Choose?
Is it best to aim for the median or the average of the demand? Well, the answer is not black and white. As we will discuss in the next pages, each technique has some benefits and some risks. Only experimentation will reveal which technique works best for a specific dataset. You can even choose to use both RMSE and MAE.
Let’s take some time to discuss the impact of choosing either RMSE or MAE on forecast bias, outliers sensitivity, and intermittent demand.
Bias
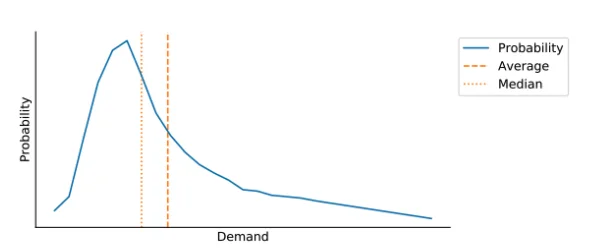
For many products, you will observe that the median demand is not the same as the average demand. The demand will most likely have some peaks here and there that will result in a skewed distribution. These skewed demand distributions are widespread in supply chain, as the peaks can be due to periodic promotions or clients ordering in bulk. This will cause the demand median to be below the average demand, as shown below.
This means that a forecast that is minimizing MAE will result in a bias, most often resulting in an undershoot of the demand. A forecast that is minimizing RMSE will not result in bias (as it aims for the average). This is definitely MAE’s main weakness.
Sensitivity to Outliers
As we discussed, RMSE gives a bigger importance to the highest errors. This comes at a cost: a sensitivity to outliers. Let’s imagine an item with a smooth demand pattern as shown in Table 2.2.
The median is 8.5 and the average is 9.5. We already observed that if we make a forecast that minimizes MAE, we will forecast the median (8.5) and we would be on average undershooting the demand by 1 unit (bias = -1). You might then prefer to minimize RMSE and to forecast the average (9.5) to avoid this situation. Nevertheless, let’s now imagine that we have one new demand observation of 100, as shown in Table 2.3.
The median is still 8.5 — it hasn’t changed! — but the average is now 18.1. In this case, you might not want to forecast the average and might revert back to a forecast of the median.
Generally speaking, the median is more robust to outliers than the average. In a supply chain environment, this is important because we can face many outliers due to demand peaks (marketing, promotions, spot deals) or encoding mistakes.
Intermittent Demand
Is robustness to outliers always a good thing? No.
Unfortunately, as we will see, the median’s robustness to outliers can result in a very annoying effect for items with intermittent demand.
Let’s imagine that we sell a product to a single client. It is a highly profitable product and our unique client seems to make an order one week out of three, but without any recognizable pattern. The client always orders the product in batches of 100. We then have an average weekly demand of 33 pieces and a demand median of… 0.
We have to populate a weekly forecast for this product. Let’s imagine we do a first forecast that aims for the average demand (33 pieces). Over the long-term, we will obtain a total squared error of 6 667 (RMSE of 81.6), and a total absolute error of 133.
Now, if we forecast the demand median (0), we obtain a total absolute error of 100 (MAE of 33) and a total squared error of 10.000 (RMSE of 58).
As we can see, MAE is a bad KPI to use for intermittent demand. As soon as you have more than half of the periods without demand, the optimal forecast is… 0!
Going Further – A trick to use against intermittent demand items is to aggregate the demand to a higher time horizon. For example, if the demand is intermittent at a weekly level, you could test a monthly forecast or even a quarterly forecast. You can always disaggregate the forecast back into the original time bucket by simply dividing it. This technique can allow you to use MAE as a KPI and smooth demand peaks at the same time.
Conclusion
MAE provides protection against outliers, whereas RMSE provides the assurance to get an unbiased forecast. Which indicator should you use? There is, unfortunately, no definitive answer. As a supply chain data scientist, you should experiment: if using MAE as a KPI results in a high bias, you might want to use RMSE. If the dataset contains many outliers, resulting in a skewed forecast, you might want to use MAE.
Pro-Tip – KPI and Reporting – Note as well that you can choose to report forecast accuracy to management using one or more KPIs (typically MAE and bias), but use another one (RMSE?) to optimize your models.


