−2.7%
finished-goods inventory for every 1% of forecast improvement, with 3.2% lower transportation costs and 3.9% less obsolete inventory.
Gartner, “Win the Business Case for Investment to Improve Forecast Accuracy”, 2017. Consumer products.
One machine-learning engine forecasts your whole portfolio, new products included. It learns from your promotions, prices, shortages and sell-outs.


















The forecast engine created by SupChains allowed our demand planning team to improve our forecasting accuracy by 20 points in a matter of months, an objective we have had for a few years.
 Sesh AddankiCOO, Vantage
…in the first 2 months of using SupChains’ model, over 50% of our forecasts were 100% ML-based…
Read the full quote
We worked to redesign our monthly forecasting process, including the machine learning baseline forecast in our forecasting tool. And in the first 2 months of using SupChains’ model, over 50% of our forecasts were 100% ML-based, with the remaining products having value added to the baseline by the planners, or being assessed to understand what data issues are driving significant differences vs planners’ assessment of the situation.
Still, machine learning is much less work than our previous experience implementing and maintaining statistical models. The initial results are strong across large parts of our portfolio.
 Alex SugdenGroup Supply Chain Director, Animalcare
Our forecasts are now reliable, easy to generate, and allow us to simulate different scenarios.
Read the full quote
We called on Nicolas to help us set up a forecasting tool for incoming flows. Nicolas quickly understood our needs, gathered, and centralized all the necessary data. He delivered a valuable tool that we now use regularly. Our forecasts are now reliable, easy to generate, and allow us to simulate different scenarios. His support was both effective and thoughtful. We benefited from his advice and experience.
 Stéphanie HerrouDemand Forecasting Manager, GENERATION
Better forecasts cut inventory and shortages at the same time. Here is how much, according to three studies and our own simulations.
−2.7%
finished-goods inventory for every 1% of forecast improvement, with 3.2% lower transportation costs and 3.9% less obsolete inventory.
Gartner, “Win the Business Case for Investment to Improve Forecast Accuracy”, 2017. Consumer products.
+3%
pre-tax improvement or more, from a 15% forecast accuracy improvement, in the experience of the Institute of Business Forecasting.
−5%
inventory costs, and 2 to 3% more revenue, from 10 to 20% better forecast accuracy.
McKinsey, “Most of AI’s business uses will be in two areas”, 2018. Advanced manufacturing.
−4%
inventory, or 6% fewer shortages, from 10% better forecasts.
SupChains simulations, “What’s the Business Impact of 10% Extra Forecast Accuracy?”
I read the first three as orders of magnitude. Our own simulations give smaller numbers, and the gain is still large.
Impact 1
in m$/year
Impact 2
in m$/year

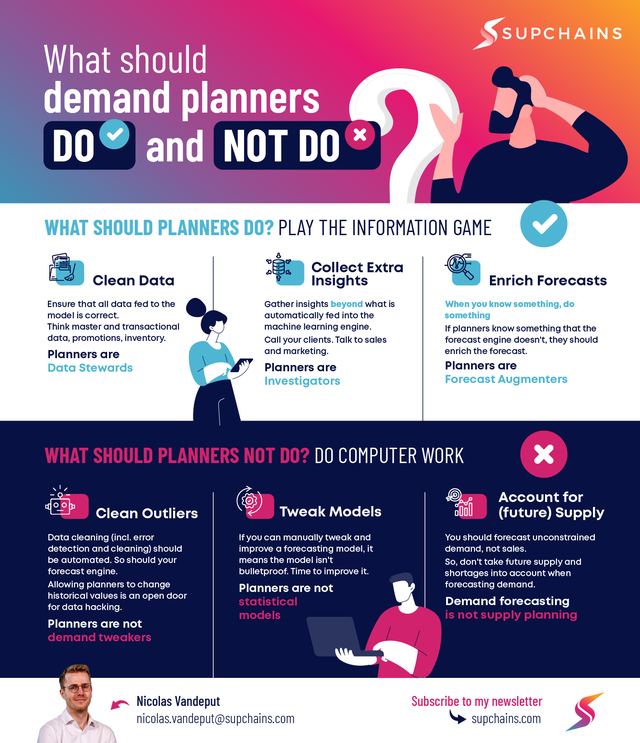
That is what Fildes and Goodwin found.
So we coach your team to do better, as we do with all our clients.
1 to 2 weeks
What to forecast, at the level your supply decisions need.
A few months
We collect and clean it with your team, in online or on-site workshops.
1 to 3 weeks to build the model
We hold back your latest months and forecast them. We compare the result with your current forecast and a moving average, on data the model never saw.
Every month
You get the forecast in the App, or as files for your current planning software. With a licence, your team runs the engine.
Our 13 demand and inventory planning practices
16 articles and 7 infographics, free to download
 Discover the SupChains Way
Planners review and enrich the forecast in the App. Leadership tracks Forecast Value Added across every dimension.
See the App