
VN1 forecasting competition
In 2024, I organized VN1, a forecasting competition on real retail data. In total, 978 participants registered to forecast 13 weeks of sales. Download the data and the official scoring code, and test your models against the winners.
Sponsors: Flieber, Syrup and SupChains. Platform: DataSource.ai.


- 15,053 weekly sales series
- 20,000€ in prizes
- 46.4% winning score, lower is better
The task: Forecast 13 weeks of sales for 15,053 product-warehouse combinations.
Flieber, one of the sponsors, provided the sales of 46 e-vendors. Each series is one product in one warehouse. The data covers 11,171 products in 328 warehouses.
The history covers 170 weeks, from July 2020 to October 2023. Competitors also received the actual historical prices, based on transactions.
Some products ran out of stock in the past. The data does not mark these weeks, so they look like weeks without demand. We only kept products that never ran out of stock in the evaluation period.
12 September to 3 October 2024
Phase 1, the warm-up
Competitors forecast 13 weeks from the 170 weeks of history. A live leaderboard showed their scores.
3 to 17 October 2024
Phase 2, the final
We added the 13 weeks of phase 1 to the history. Competitors then forecast the next 13 weeks. Only their last forecast counted, and no score showed until the end.
13 November 2024
The webinar
The top 5 explained their models.
The score that ranked the participants
MAE% + |Bias%|
MAE% is the sum of the absolute errors, divided by total sales. Bias% is the total error, divided by total sales. A perfect forecast scores 0%.
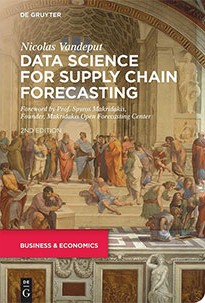
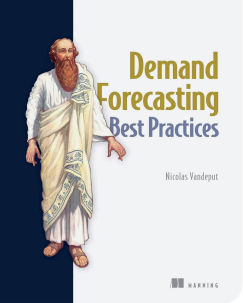
This score offers an excellent trade-off between simplicity and business value. I explain it in Data Science for Supply Chain Forecasting and Demand Forecasting Best Practices.
The code
abs_err = np.nansum(abs(forecast - sales))
err = np.nansum(forecast - sales)
score = abs_err + abs(err)
score /= np.nansum(sales)
Few beat the naïve forecast
| Phase 2 | Score | |
|---|---|---|
| 1st | Jakub Figura and Philip Stubbs | 46.4% |
| 2nd | Justin Furlotte | 46.6% |
| 3rd | Arsa Nikzad | 47.6% |
| 4th | Antoine Schwartz | 47.7% |
| 5th | An Hoang | 48.1% |
| Naïve forecast | 50.7% | |
| 12-week moving average | 80.5% | |
Competitors had to beat a 12-week moving average, and most of them did. Because of the seasonality in the data, the naïve forecast did exceptionally well in phase 2, while the 12-week moving average did very poorly.
Usually, a naïve forecast is easy to beat, so I do not advise it as a benchmark.
Units sold per week, all 15,053 series together

The top 5 explain their models
Webinar, November 2024
What the winners did
After the competition, I interviewed the top 20 about their methods.
- They tested many models before they chose one. Their key skill was a fast and robust way to evaluate models.
- LightGBM was the most used model at the top.
- Most of them combined several models, or several runs of the same model.
- Half wrote less than 300 lines of code. Nearly all solutions ran in less than 10 minutes.
- Only two flagged outliers. None used Facebook Prophet.
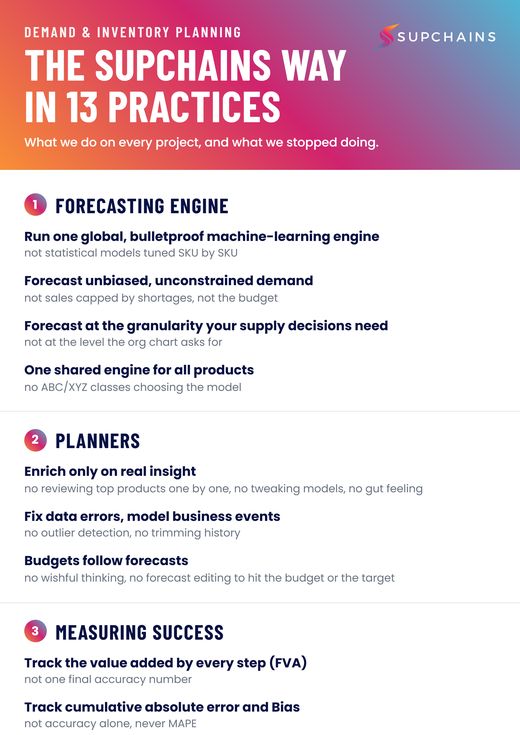
Their methods match the practices we apply on every client project.
Try it yourself
You can replay the competition on your own and score your forecasts with the official code.
- Replay phase 1. Train on Phase 0 and forecast 13 weeks. Score your forecast against Phase 1 sales.
- Replay phase 2. Add Phase 1 to the history and forecast the next 13 weeks. Score it against Phase 2 sales.
| Phase 0 - Sales.csv | Units sold per week, July 2020 to October 2023 |
|---|---|
| Phase 0 - Price.csv | Price per week, from the transactions |
| Phase 1 - Sales.csv, Price.csv | 13 weeks, October 2023 to January 2024 |
| Phase 2 - Sales.csv | The final ranking, January to April 2024 |
| Top 5 forecasts | The five winning forecasts, by rank |
| vn1_score.py | The official score |
| vn1_benchmarks.py | Moving average and naïve forecast |
| README.md | The rules, the data and the score |
The zip holds no phase 2 prices, because competitors never received them.
How to cite VN1. The data is free to use. When you use it, please cite the competition.
Vandeput, N. (2024). VN1 Forecasting – Accuracy Challenge. Organized by Nicolas Vandeput (SupChains). Data provided by Flieber. Sponsored by Flieber, Syrup and SupChains. https://supchains.com/vn1-forecasting-competition/
BibTeX
@misc{vandeput2024vn1,
  author       = {Vandeput, Nicolas},
  title        = {{VN1} Forecasting -- Accuracy Challenge},
  year         = {2024},
  howpublished = {\url{https://supchains.com/vn1-forecasting-competition/}},
  note         = {Organized by Nicolas Vandeput (SupChains). Data provided by Flieber. Sponsored by Flieber, Syrup and SupChains.}
}
The original competition pages stay online on DataSource.ai.

Free chapters of our latest book
You also get the SupChains Way, then one lesson every two weeks.