
VN2 inventory competition
In 2025, I organized VN2, the first public inventory planning competition. Over 180 participants placed six weekly orders for 599 store-product combinations, on real retail data. Download the data and the official simulator, and test your inventory policy against the winners.
Sponsors: Flieber, Daybreak and SupChains. Platform: DataSource.ai.


- 599 store-product combinations
- 20,000€ in prizes
- 13.2% lower cost than the benchmark, for the winner
The task: Place six weekly orders that minimize holding and shortage costs.
The data comes from an anonymous retailer, with 297 products in 67 stores. That makes 599 store-product combinations. Competitors received 157 weeks of sales, from April 2021 to April 2024.
Each week, competitors ordered from the central warehouse. An order takes two weeks to arrive, and a sale missed for lack of stock is lost. The supplier has no capacity limit.
Most products ran out of stock in the past. Each week, a flag says whether the store had stock left at the end of the week. As the data is real, some flags may be wrong.
29 September 2025
The data
Competitors received the sales history, the stock flags and the product hierarchy.
21 October to 5 November 2025
Six rounds
One order every two or three days. After each round, competitors received the new week of sales and their own inventory.
4 December 2025
The webinar
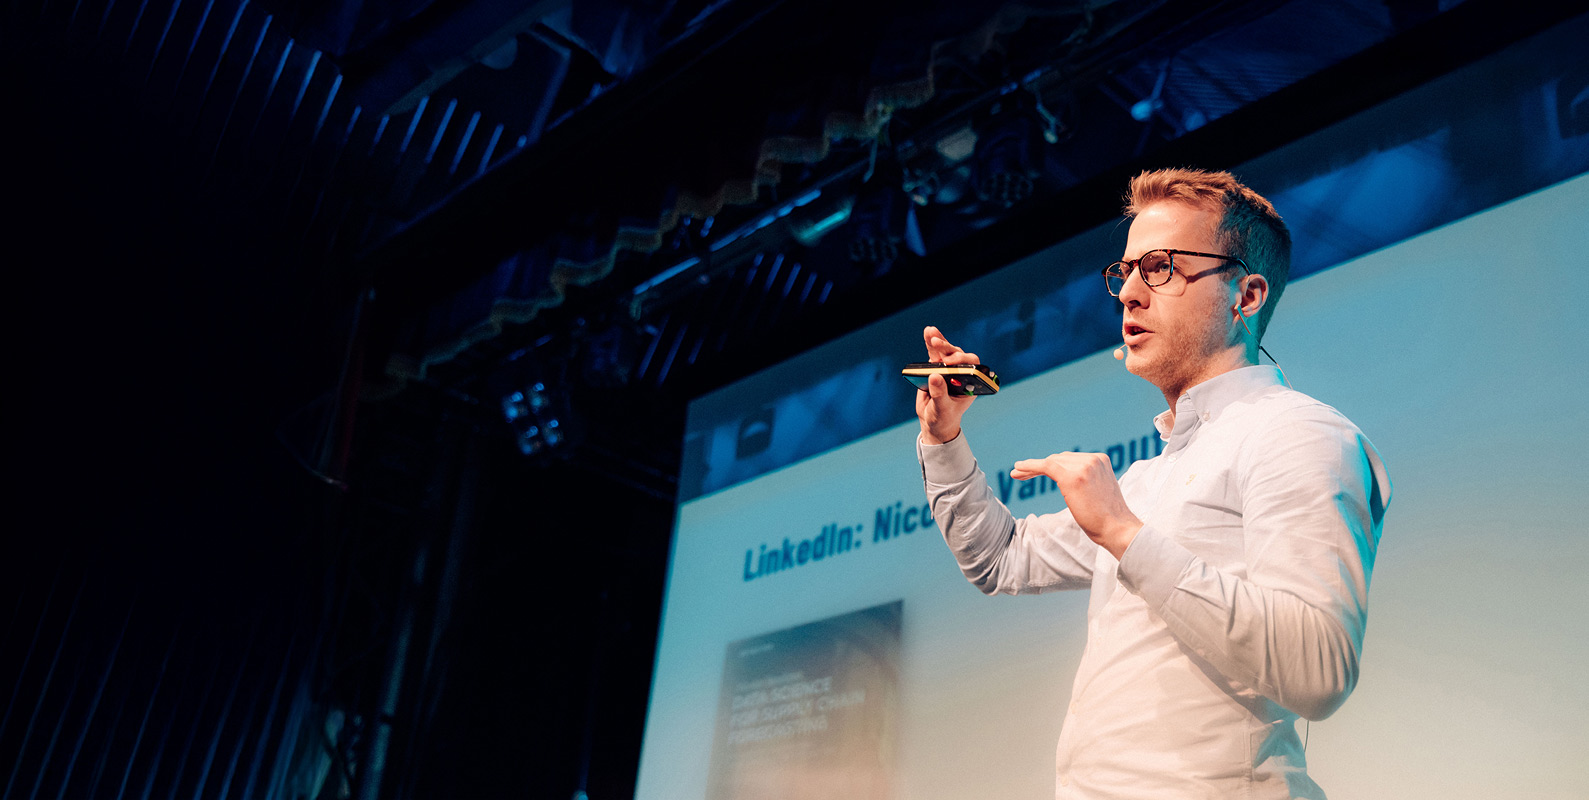
The top 5 explained their models.
The cost that ranked the participants
0.2€ × units left + 1€ × sales lost
Each unit left on the shelf at the end of a week costs 0.2€. Each sale lost for lack of stock costs 1€. Goods in transit cost nothing.
The score is the cost of weeks 3 to 8. Weeks 1 and 2 cost every player 913.8€, as no order made by the participants could impact them.
Judging an inventory policy is harder than judging a forecast. The only way is to see which policy results in the lowest total cost over time.
The code
start = end_inventory + arriving_this_week
sales = min(start, demand)
lost = demand - sales
end_inventory = start - sales
cost = 0.2 * end_inventory + 1.0 * lost
How the simulation works
An example with one product, ordered with the benchmark policy
End of week 8. The score of this product, the cost of weeks 3 to 8, is 12.8€.
| Week | Order placed at the start of the week | Starting inventory | Receipts | Demand | Lost sales | Ending inventory | Holding cost | Shortage cost | Score, weeks 3 to 8 |
|---|---|---|---|---|---|---|---|---|---|
| 1 (not scored) | 23 | 7 | 0 | 5 | 0 | 2 | 0.4€ | 0€ | – |
| 2 (not scored) | 4 | 2 | +5 | 8 | 1 | 0 | 0€ | 1€ | – |
| 3 | 5 | 0 | +23 | 4 | 0 | 19 | 3.8€ | 0€ | 3.8€ |
| 4 | 1 | 19 | +4 | 10 | 0 | 13 | 2.6€ | 0€ | 6.4€ |
| 5 | 6 | 13 | +5 | 11 | 0 | 7 | 1.4€ | 0€ | 7.8€ |
| 6 | 15 | 7 | +1 | 10 | 2 | 0 | 0€ | 2€ | 9.8€ |
| 7 | – | 0 | +6 | 7 | 1 | 0 | 0€ | 1€ | 10.8€ |
| 8 | – | 0 | +15 | 5 | 0 | 10 | 2€ | 0€ | 12.8€ |
Only 25 of 180 beat the benchmark
| Final ranking | Cost, weeks 3 to 8 | |
|---|---|---|
| 1st | Bartosz Szabłowski | 3,763€ |
| 2nd | Matias Alvo | 3,765€ |
| 3rd | Philip Stubbs and Jakub Figura | 3,792€ |
| 4th | Carlo Cavalieri | 3,794€ |
| 5th | Ruben van de Geer, Diederik Perdok and Simon Grest | 3,824€ |
| 26th | Benchmark | 4,334€ |
The benchmark is a 13-week moving average with seasonal weights. It orders up to 4 weeks of forecast and takes 55 lines of Python. Only 25 of the 180 participants beat it, and most end-to-end models did not.
The benchmark wasn't optimized, and its 4-week coverage was too long. With 3.5 weeks, it would have scored about 3,900€, the sixth place.

The top 5 explain their models
Webinar, December 2025
What the winners did
After the competition, I interviewed the top 20 about their methods.
- Each of them tested and tuned their policy on the past, by simulation.
- They projected their inventory to the week the order arrives, with the shortages expected before it.
- Mean forecasts and probabilistic forecasts both reached the top 5. LightGBM and CatBoost led the forecasts.
- The second place used reinforcement learning to place the orders.
- No participant using DDMRP, ABC segmentation or demand-pattern classes beat the benchmark.
At SupChains, we set inventory targets the same way, by simulation on real demand and real forecasts.

Try it yourself
You can replay the six rounds on your own and score your orders with the official simulator.
- Write your policy. One Python function receives the sales, the stock flags and your inventory. It returns 599 orders.
- Play the six rounds. vn2_play.py calls your function before each week, with only the data known that week. Then it prints your cost, week by week.
- Compare. The benchmark scores 4,334€. The winner scored 3,763€.
| Week 0 - Sales.csv | Units sold per week, April 2021 to April 2024 |
|---|---|
| Week 0 - In Stock.csv | The stock flag of each week |
| Week 0 - Master.csv | The product and store hierarchy |
| Week 0 - Initial State.csv | The stock and the orders on the road before week 1 |
| Week 1 to 8 - Sales.csv | One more week of sales per round |
| vn2_play.py | Plays your policy for the six rounds |
| vn2_simulate.py | The official rules; scores six order files |
| vn2_benchmark.py | The benchmark, 4,334€ |
| README.md | The rules, the data and the score |
How to cite VN2. The data is free to use. When you use it, please cite the competition.
Vandeput, N. (2025). VN2 Inventory Planning Challenge. Organized by Nicolas Vandeput (SupChains). Sponsored by Flieber, Daybreak and SupChains. https://supchains.com/vn2-inventory-competition/
BibTeX
@misc{vandeput2025vn2,
  author       = {Vandeput, Nicolas},
  title        = {{VN2} Inventory Planning Challenge},
  year         = {2025},
  howpublished = {\url{https://supchains.com/vn2-inventory-competition/}},
  note         = {Organized by Nicolas Vandeput (SupChains). Sponsored by Flieber, Daybreak and SupChains.}
}
The original competition pages stay online on DataSource.ai.
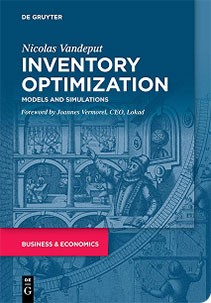
Free chapters of our latest book
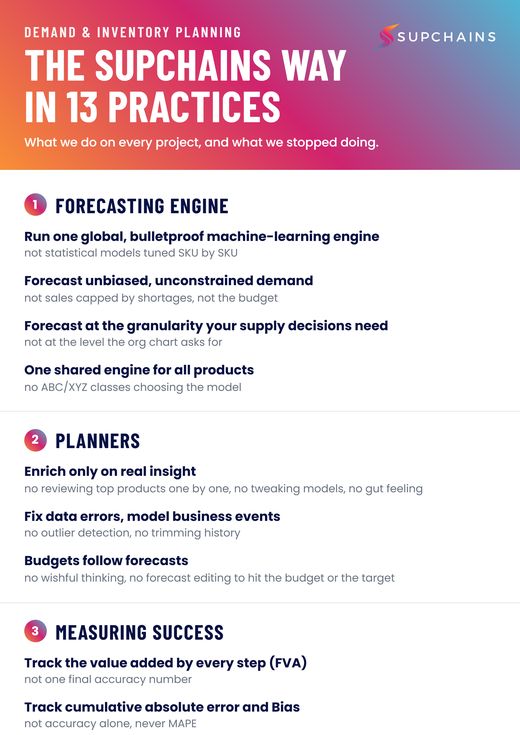
You also get the SupChains Way, then one lesson every two weeks.